A. Initial data.
Walls
hall brick plastered and
painted with water-based paint;
the ceiling has adhesive whitewash; floors
wooden s
linoleum
coated; chairs are hard. The hall has
4 windows
opening
filled with double-glazed windows
area 35.2m2
and 2
door
openings with a total area of 6.2 m2
. The volume of the hall is 9.0 x 14.9 x 7.0 = 938.7 m3.
Odds
sound absorption of internal surfaces
hall for frequencies of 125, 500 and 2000 Hz are given
in table. one.
Table 1
|
№ p/n |
Name
internal |
Odds
finishes |
||
|
125 |
500 |
2000 |
||
|
1 |
Wall |
0,01 |
0,01 |
0,02 |
|
2 |
Ceiling |
0,02 |
0,02 |
0,04 |
|
3 |
Floor |
0,02 |
0,03 |
0,04 |
|
4 |
Window infills |
0,3 |
0,15 |
0,06 |
|
5 |
The place occupied |
0,2 |
0,3 |
0,35 |
|
6 |
Place not occupied listener |
0,02 |
0,03 |
0,04 |
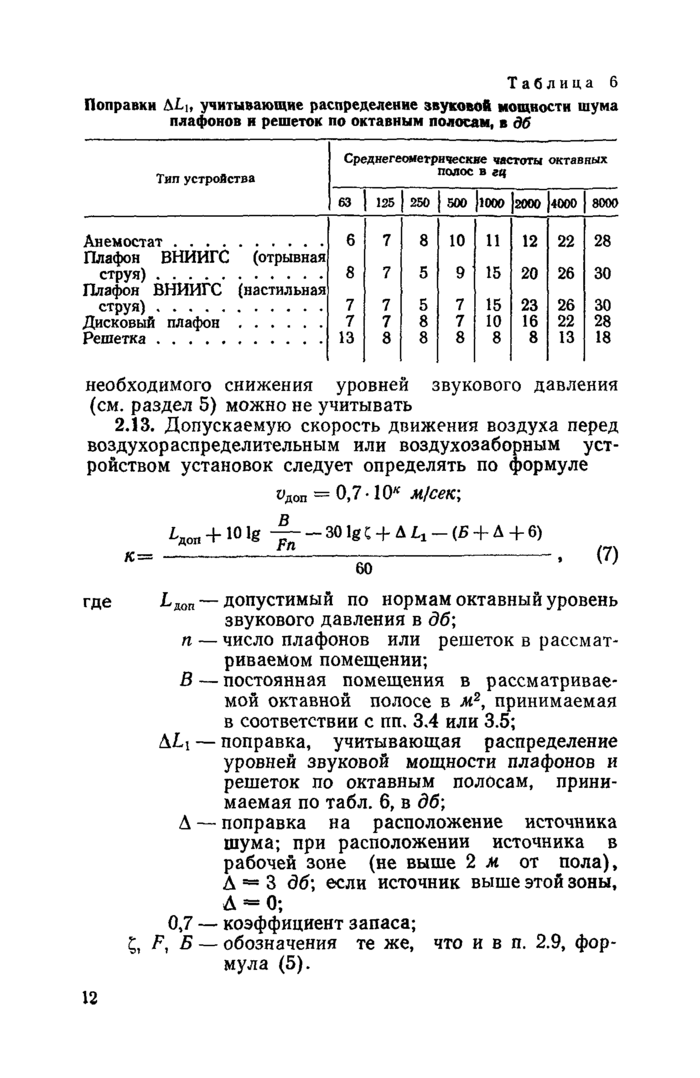
Settlement points are located on the territory adjacent to the building
Fan noise
propagates through the duct and
radiated into the environment
through a grate or shaft, directly
through the walls of the fan housing or
open pipe during installation
fan outside the building.
At a distance from
a lot of fan up to the design point
larger than its dimensions, the source of noise can be
consider point.
V
in this case, the octave levels of the sound
pressures at design points are determined
according to the formula
where
L Okti
— octave sound power level
noise source, dB;
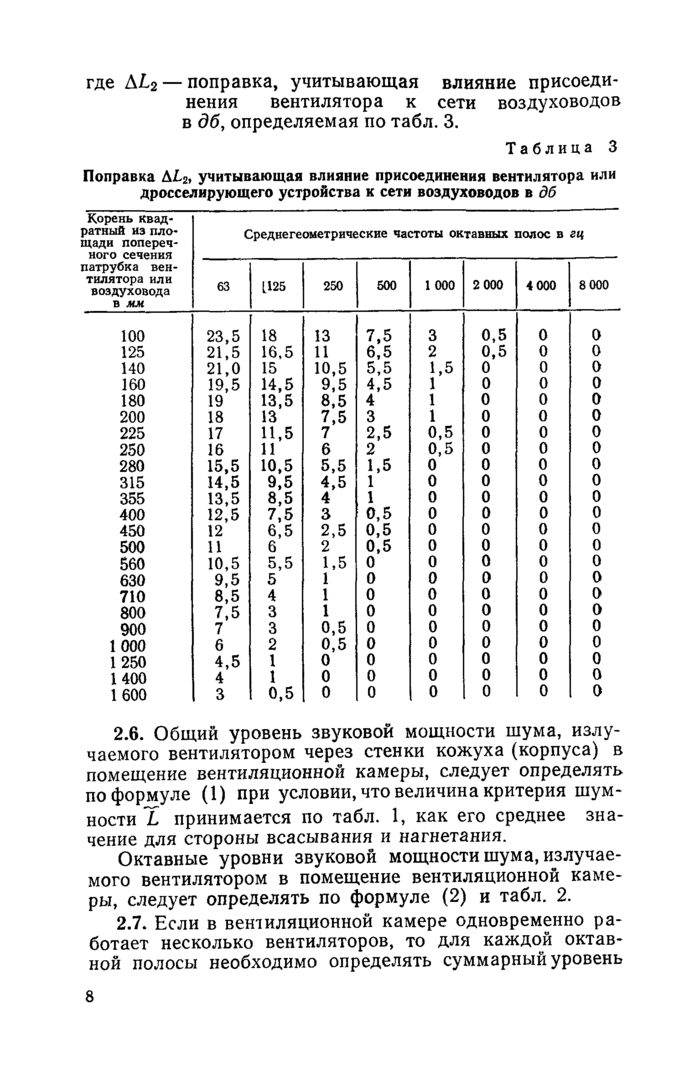
∆L Pneti
is the total reduction in the level of sound
power along the sound path
in the duct in the considered octave
band, dB;
∆L ni
- indicator of radiation directivity
sound, dB;
r
is the distance from the noise source to
design point, m;
W
is the spatial radiation angle
sound;
b a
is the attenuation of sound in the atmosphere, dB/km.
page 1

(Gosstroy USSR)
CH 399-69
MOSCOW - 1970
Official edition
STATE COMMITTEE OF THE USSR COUNCIL OF MINISTERS FOR CONSTRUCTION
(Gosstroy USSR)
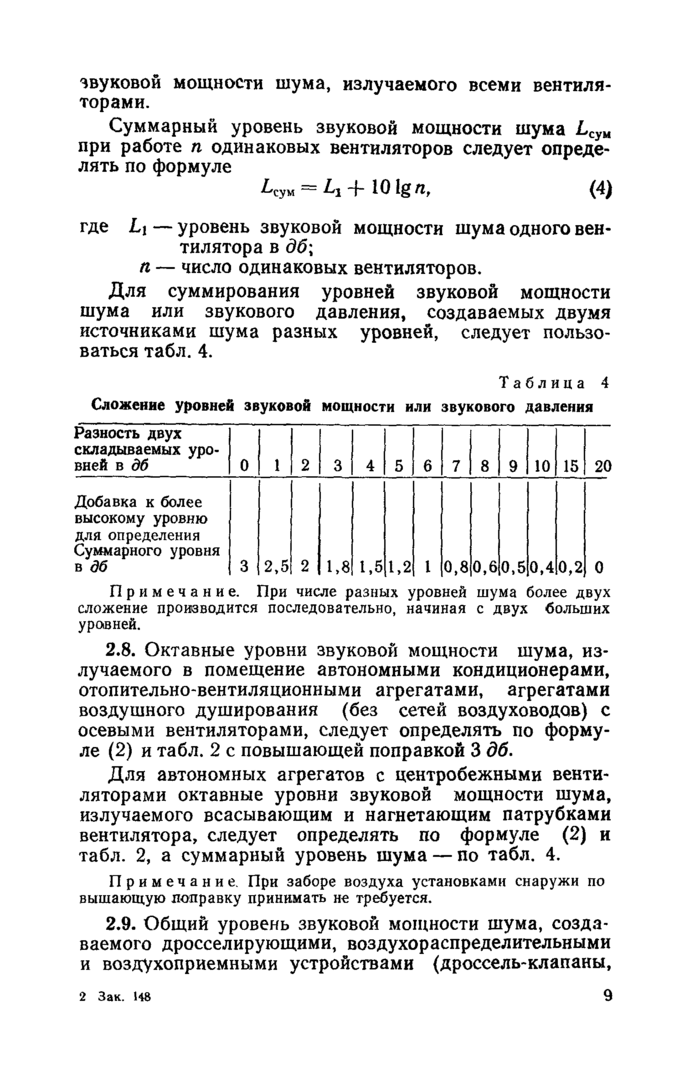
6.1.1. Adding Noise from Multiple Sources
At
hitting the calculated point of noise from
multiple sources add up them
intensity. Intensity level
with the simultaneous operation of these sources
defined as
(4.12)
where
Li– intensity level (or sound
pressure)i-th source;n- number
sources.
If
All noise sources have the same
intensity level, then
(4.13)
For
summation of noise from two sources
dependency can be applied
(4.14)
where
–max(L1,L2) –
maximum intensity level value
from two sources; ΔL- additive determined according to table 4.2
depending on the modulus of the difference
intensitiesL1andL2.
table
4.2
Definition
additives ΔL
|
|L1-L2| |
1 |
2 |
4 |
6 |
8 |
10 |
15 |
20 |
|
ΔL |
3 |
2,5 |
2 |
1,5 |
1 |
0,6 |
0,4 |
0,2 |
At
If necessary, this method can
spread to any number
noise sources.
Considered
features of level summation
allow us to draw a practical conclusion
about what to reduce indoor noise
you must first reduce the noise from more
powerful sources.
122. BASIC PROVISIONS OF THE ACOUSTIC CALCULATION OF THE VENTILATION SYSTEM
|
Task acoustic calculation The calculations must take into account not only the noise generated Levels decrease along the path of air movement There are three main cases of the position of the calculated point, in The acoustic calculation of the ventilation system must The rated noise in the room can only be set Acoustic calculation of ventilation systems should be |
Especially violent acoustics began to develop when
people have learned to transmit sound ... by
The echo is being picked up acoustic receivers, devices similar in
operating principle with...
Acoustics. acoustic
Technics.Acoustic materials and products. The noise level is significantly reduced
if based on the methods of architectural acoustics …
Acoustics. acoustic
Technics.Acoustic materials and products. The noise level is significantly reduced
if based on the methods of architectural acoustics …
Acoustic
test method - resonant, ultrasonic, impact - the most developed and
implemented in the practice of building Islands.
- materials intended to improve acoustic
properties of the premises. Acoustic materials are divided into finishing and
gaskets.
Acoustics. acoustic
Technics.
architectural acoustics is a branch of building physics that deals with
sound processes in the room.
Acoustics. acoustic
Technics. Piezo elements. The echo is being picked up acoustic receivers,
devices similar in principle to the operation of a microphone.
Testing acoustic airborne calculations
noise. Acoustic the calculation is made for each of the eight octave bands
hearing range...
Preliminary calculation of the reverberation and sound absorption time at a frequency of 125, 500 and 2000 Hz.
To calculate the reverberation time, it is necessary to calculate the average absorption coefficient in the room and determine the required amount of sound-absorbing material to be introduced.
When calculating, we will assume that the side walls up to 2m are covered with wooden panels, above 2m they are plastered and painted; ceiling, canopy and bottom of the balcony - painted concrete slabs; the floor under the seats and in the aisles is covered with a carpet; the places themselves have a soft base; the exit doors of the hall are covered with velvet curtains; the stage is made of boards covered with parquet.
So let's make a table. 2.1, in which, for all the surfaces listed above, we enter the value of their areas and absorption coefficients at the corresponding frequencies, and then, using formula (2.1), we calculate the average values of the absorption coefficients at these frequencies and also enter them in this table:
where are the absorption coefficients of the surfaces in the hall
the corresponding areas of these surfaces
S is the area of all surfaces in the hall
Table 2.1 - Preliminary absorption calculation
|
Surface |
S, m2 |
treatment |
A |
aS |
a |
aS |
a |
aS |
|
125 Hz |
500 Hz |
2000 Hz |
||||||
|
Ceiling: |
||||||||
|
443,86 |
painted concrete |
0,01 |
4,44 |
0,01 |
4,44 |
0,02 |
8,88 |
|
|
side. Wall: |
||||||||
|
wall above 2m |
445,1 |
piece brick. env |
0,01 |
4,45 |
0,02 |
8,90 |
0,04 |
15,58 |
|
wall below 2m |
112,72 |
wood panel |
0,25 |
28,18 |
0,06 |
6,76 |
0,04 |
4,51 |
|
curtains |
14 |
Velvet |
0,10 |
1,40 |
0,50 |
7,00 |
0,72 |
10,08 |
|
ventilation |
1,28 |
iron grate |
0,30 |
0,38 |
0,50 |
0,64 |
0,50 |
0,64 |
|
floor: |
||||||||
|
armchairs |
261,4 |
Soft |
0,15 |
39,21 |
0,20 |
52,28 |
0,30 |
78,42 |
|
Floor |
113,9 |
carpet |
0,02 |
2,28 |
0,07 |
7,97 |
0,29 |
33,03 |
|
Scene |
57,26 |
wood parquet |
0,10 |
5,73 |
0,12 |
6,87 |
0,06 |
3,44 |
|
rear Wall: |
||||||||
|
hardware windows |
0,64 |
Glass |
0,30 |
0,19 |
0,15 |
0,10 |
0,06 |
0,04 |
|
curtains |
10 |
Velvet |
0,10 |
1,00 |
0,50 |
5,00 |
0,72 |
7,20 |
|
ventilation |
0,8 |
iron grate |
0,30 |
0,24 |
0,50 |
0,40 |
0,50 |
0,40 |
|
Wall |
120,93 |
plastered brick |
0,01 |
1,21 |
0,02 |
2,42 |
0,04 |
4,23 |
|
balcony: |
||||||||
|
armchairs |
82,08 |
Soft |
0,15 |
12,31 |
0,20 |
16,42 |
0,30 |
24,62 |
|
Floor |
29,28 |
carpet |
0,02 |
0,59 |
0,07 |
2,05 |
0,29 |
8,49 |
|
balcony end |
17,4 |
painted concrete |
0,01 |
0,17 |
0,01 |
0,17 |
0,02 |
0,35 |
|
bottom of the balcony |
112,18 |
painted concrete |
0,01 |
1,12 |
0,01 |
1,12 |
0,02 |
2,24 |
|
front. Wall: |
||||||||
|
stage end |
14,4 |
wood parquet |
0,10 |
1,44 |
0,12 |
1,73 |
0,06 |
0,86 |
|
Wall |
77,25 |
plastered brick |
0,01 |
0,77 |
0,02 |
1,55 |
0,04 |
2,70 |
|
sum |
1914,5 |
105,1 |
125,8 |
205,7 |
||||
|
asr |
0,055 |
0,066 |
0,107 |
The table below shows how much the average absorption coefficient differs at different frequencies. Now, knowing the average value of the absorption coefficient for all frequencies, using the Eyring formula, we can determine the standard reverberation time:
where - the area of the inner surface of the hall, taking into account the rise of the floor and the balcony
is the average value of the absorption coefficient
V is the volume of the hall
Substituting the obtained values of the sound absorption coefficient from the table. 2.1 and calculated in the first section the value of the overall dimensions of the hall in the formula (2.2), we obtain the frequency response of the reverberation time of the acoustically untreated hall, we will enter these calculations in Table. 2.2:
Table 2.2 - Frequency response of reverberation time in an untreated room
|
frequency Hz |
125 |
500 |
1000 |
|
reverberation time, s |
7,330 |
6,090 |
3,641 |
As you can see, the values of the reverberation time turned out to be much larger than the optimal reverberation time specified in paragraph 2.1. In this regard, in order to bring the value of the reverberation time in the calculated hall closer to the optimal one, it is necessary to perform additional acoustic treatment of the internal surfaces of the hall.
SECTION 7. STUDIO AND ROOM ACOUSTICS
7.1. ACOUSTIC CHARACTERISTICS OF THE ROOM
In communication and broadcasting systems, premises are divided into two types: those in which speech and artistic programs are transmitted (transmitting premises), and those in which these transmissions are received (reception premises). Of the transmitting premises for broadcasting, the main type of premises are studios, although in the general case they can be any premises, if, for example, it is necessary to transmit actual programs. Reception rooms include all rooms in which listeners can be, such as: living rooms, auditoriums, concert halls and theaters, cinemas, stations, factory floors, etc. In some cases, for example, in sound amplification, the receiving room is combined with the transmitting one. For communication use almost any premises in which a person can be.
The studio is a room specially designed for the performance of speech and music programs. A broadcasting or television studio is a studio that is used to create radio or television programs. At film studios, these premises are called tonateliers, and at film complexes of television centers, they are called film dubbing studios.
To obtain the required acoustic characteristics of the premises, they are subjected to special acoustic treatment.
Let us first consider the sound processes occurring in the premises and their influence on the sound features of the program perceived by the listeners. For rooms with a simple shape (for example, rectangular), the wave theory of characteristics analysis is used. But in engineering practice, they use simpler, albeit less rigorous, calculation methods based on the statistical theory of considering resound processes.
According to the wave theory, the natural frequencies of the room with the length, width and height are determined from the expression
where c is the speed of sound in air; integers from zero to infinity. Each of the ratios of numbers corresponds to one of the natural frequencies of the room.
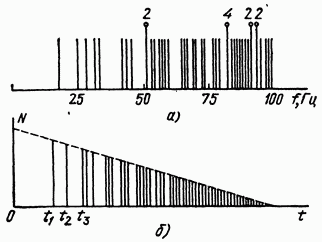
As an example, in fig. 7.1, a shows the spectrum of natural frequencies of the air volume of the room with dimensions. The figure shows only frequencies lying in the Hz interval. In the region of low frequencies, corresponding to small values of numbers, natural frequencies are separated from each other by relatively large intervals. The eigenfrequency spectrum here has an essentially discrete structure. In the region of higher frequencies, the spectrum noticeably condenses, the intervals between adjacent natural frequencies are reduced, and the number of natural oscillations in a given section of the spectrum rapidly increases. In some cases, various forms of natural oscillations, i.e.forms corresponding to different combinations of numbers may coincide in frequency. Such forms are shown in Fig. 7.1, but with elongated lines. The numbers above them indicate the number of forms with matching frequencies.
When the sound source is turned off, the process of damping of oscillations in it occurs at all natural frequencies of the room, and at each of them it has the form
where is the attenuation index, determined from the condition of reflection of the will at the boundaries of the room for natural frequency; the initial amplitude of oscillations, for example, sound pressure, determined from the condition of the distribution of oscillation amplitudes in the room for natural frequency.
The process of damping vibrations in a room is called reverberation. The sound decay curve does not have a monotonous shape due to the beating between natural frequencies. On fig. 7.1, b shows an approximate temporal structure of a reverberant signal assuming exponential decay, when the level of reflected signals decreases linearly with time. At the initial stage of the resound process, the structure of the reflected signals (echo signals)
Rice. 7.1. The natural frequency spectrum of the room (a) and the temporal structure of the reverberant signal in it (b)
